A while back a Seeking Alpha author advocated long-term trending of the S&P500, and "it got my goat"...
Long-term trending doesn’t make sense to me, not when there are undeniable cycles in the market, known as SECULAR Bull and Bear markets.
I’ll trend in a SECULAR Bull Market; buy and hold works.
But in a SECULAR Bear Market, the market moves down, often quickly.
Who wants to buy or hold when the markets are falling? Not me.
As you can see from the long-term Dow chart below, there are
distinct periods in the market which we call secular bull and
bear markets.
click to enlarge (any chart or table)

In a secular bull, even the proverbial monkey can make a lot of money using a Wall Street Journal dart board (“buy and hold”). The secular bull of the “20s” went up 5x. The “50s” were up 10x. And the “80s”, the wonderful 80s, up 14x.
These gains were achieved with relatively low volatility and few corrections over 20%, with the notable exception of the 1987 crash.
Bear market mauling!
The secular bull markets of the last 90 years were “ruler” markets, “straight” up with limited volatility.
The secular Bear markets, however, aren’t even decent enough to be “rulers down”. Instead, in a secular Bear, the market mauls you, down AND UP. Down and UP. Again and again.
In the "BEARS" table below, note the number and magnitude of the down and up cycles. Four to five "down" moves, averaging 41%, followed by "fibonacci" bounces.

Charts and data first draft Sep 2009, revised 10/19/09
We'll look at the 30s Bear market and the infamous market crash of ’29, but first a note on the math: If you start at 100 and fall “50%”, you’re at 50. If you then bounce “50%”, you’re at 75. This still leaves you down 25%.
So beware, large percentage declines require significantly larger percentage gains to breakeven. The first 50% decline requires a 100% gain to get back to breakeven!
So in the “30s”, the first decline was 49%. Then it bounced 52%. Then it crashed 86%! From that low, it bounced back 101%. Do you see my point?
Just in case, let’s look a little closer.
I found the first three moves in the “30s” secular Bear to be down 49%, up 52%, and then down 86%; however, I was using a monthly chart.
Since April 1930 to July 1932 looks “ruler down”, I simply show the market as declining 86% over 27 months. But Doug Short dissects the Bear markets in greater detail using daily prices. Doug agrees with my first two measurements, but in the next move, down 86%, he found even greater volatility, much more then even I imagined.
Using Doug's daily basis, my 86% breaks down into a series of 9 moves of greater than 20%, averaging 45% down followed by a 32% bounce. If we accept the conventional wisdom, this means that my one move “down 86%” is actually 9 moves of “bull and bear market” magnitude.
That is, in 27 months, there were 9 moves of such a large magnitude as to be labeled separate bull and bear markets.
A new bull or bear every 3 months! Now that is what I call a deadly mauling.
Does nominal GDP growth matter?
In the article that prompted this blog, the author justifies his trend line projection by citing 6.9% nominal GDP growth.
Quick, what's the nominal GDP during a bull market?
How about in a bear market?
How wonderful it is that the article used 6.9%, precisely the number Ed Easterling of CrestmontResearch.com uses in his book Unexpected Returns.
In BEAR markets, nominal GDP growth is 6.9%.In BULL markets, nominal GDP averages just 6.3%.
That's right, nominal GDP is stronger in bear markets.
Why?
Bear markets are often accompanied by high inflation, which boosts "nominal" GDP, but the inflation is destructive to the market's PE multiple.
Thus nominal GDP growth can be misleading. It is impacted by the level of inflation or deflation.
So what does matter?
"It's the credit, stupid!"
Secular bull and bear markets appear to be driven by long-term expansions and contractions in the amount of credit.
Nikolai Kondratyev (aka Kondratieff) was the first to publicize the view of uncontrollable economic cycles in his book, The Major Economic Cycles (1925), although others had written of similar cycles, notably French economist Clement Juglar and British businessman and statician Joseph Kitchin.
There is much controversy surrounding these cycles, perhaps in part because they are more subjective than the mathematically definable ideas of John Maynard Keynes, the economist of the day.
Keynes believed you could control the economy whereas Kondratyev did not.
In the Great Depression, people weren’t looking for explanations, they were looking for solutions, so they bought the Keynesian solution, much to the chagrin of us Kondratyev / Schumpeterians !).
Many theories were offered up to help explain the problems of the day (presumably so that solutions could be found):
Juglar looked at the fixed investment cycle, aka “the business cycle” (7-11 years),
whereas Kitchin focused on “the inventory cycle” (3-5 years).
Simon Kuznets focused on "the infrastructure investment cycle" (15-25 years).
Certainly all these cycles exist to some degree, but when they start, when they end, and even how to measure them is debated. Moreover, they overlap.
Aggregating all these cycle theories into a “unified theory of economic cycle” is something I doubt we’ll ever see, but all these cycles are strongly influenced by credit expansion and contraction.
As Milton Friedman said, "Inflation is always and everywhere a monetary phenomenon." Too much money chasing too few goods. When credit expands, asset values increase (aka “inflate”).
In the worst case scenario, these credit expansions "bubble". Think 1990s tech stocks, oil at $150 a barrel, or housing (“which never declines in price"). If these expansions bubble too much, they burst, and we have a Minsky moment.
Greenspan seemed to be a “Kondratieff” because in the late 1990s he said he couldn’t control the Internet-driven stock market bubble. Conversely, he seemed a "Keynesian" when he kept interest rates low after the Tech bubble burst, attempting to ease the pain.
In the end, however, Greenspan “the Kondratyev” wins because the interest rates that were “too low for too long” created an even bigger bubble in housing.
Both the Tech and Housing bubbles created very bullish markets (as do all bubbles), but when they burst, the create Bear markets.
Secular Bull and Bear Market Profiles
As Bear markets age, they can age “gracefully” like in the 70s, slowly evolving into inflation.
Or they can age “rapidly,” like the 30s, with a quick market drop, spiraling down into deflation.
As shown in the Crestmont Research’s Secular Bull and Bear Markets Profile, from 1901 to 1920 (the “10s”), the stock market experienced a secular Bear market. This bear started with low inflation and a PE in the low 20s (like now). In those 20 years, the market returned a total of 2% as the PE declined from 23x to just 5x. And even worse, the last 4 years of that bear market was accompanied by double digit inflation, eroding the purchasing power of the remaining stock market assets.
Crestmont's profile also shows a secular Bear market from 1966-1981. The market declined 10% as the PE ratio shrank from the low 20x to just 9x. And the inflation rate increased from 3% to just into the double digits.
Of note, however, is the ’29 Bear. It also began with a PE multiple in the 20s, which dropped to 8x in 4 short years. However, it ended NOT with inflation, but with DEFLATION, as price declines reached double digits.
Conversely, the secular Bull markets of the 1920s, 1933-36(?), the “50s” and the “80s” all started with low PE multiples and ended, generally, when the PE multiple reached 20x or more (40x in 1999).
You should visit the main Crestmont Research's website. Better yet, buy Ed's book for a full understanding of the “PE cycles” that accompany credit cycles.
Historically, however, it’s fairly simple: At the end of Bull markets, PE multiples are high (in the 20s are common) and they begin a dramatic decline. Conversely, at the end of Bear markets, PEs have declined to single digits, typically driven there by the instability of deflation or high inflation.
Inflation or Deflation?
The debate seems to be whether we're heading into serious inflation (argues the gold bugs),
or deflation (argues the other gold bugs).
So which side of this debate are you on, inflation or deflation?
Me? I say "Does it matter?"
We all know the stock market dislikes instability.
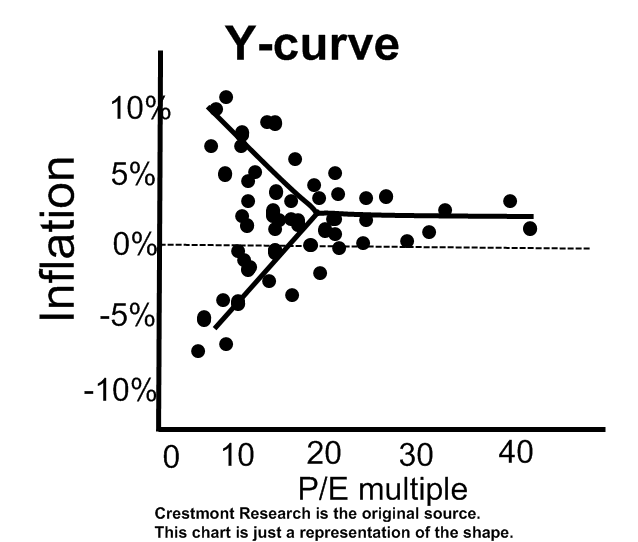
As shown in Easterling’s book Unexpected Returns, as we move from economic stability to inflation or deflation, PE multiples contract. This is called the “Y Curve Effect” and I have a representation below, although you can find Crestmont’s Y-curve here.

With 1-2% inflation, the PE multiple can range from low to very high, but high multiples only occur when inflation is low.
Let me repeat this. You only have high PE ratios when inflation is LOW (and stable).
If you start with a high multiple, like now, but then experience high inflation or deflation, the market multiple becomes depressed.
Eventually consumers become depressed. It can cascade, or move in waves, but the net result is the same: the PE declines and becomes clustered in the low single digits range.
And the market returns near nothing for a very long period of time.
If you asked me, "What do you think, are we headed to inflation or deflation?" my answer would be "Yes".
A very smart ex-Merrill Lynch broker friend of mine thinks we'll see inflation by the end of 2010. I'm more afraid that we'll continue to see asset deflation and only later inflation, but I hope my friend is right.
From the Secular Bull & Bear Markets Profile, it appears that high inflation comes near the end of “friendly” Bear markets; that is, the secular Bear market is “friendly” because it is truly ending (the “10s” and the “70s”).
If we continue to see asset deflation like I’m worried about, you may get a heck of a cyclical bull bounce (early 30s… and now?), taking the PE back to 20x, but the secular Bear market will resume.
While I'll leave it to others to determine what the current S&P earnings will be, if we assume EPS of $50, the current S&P PE is back at or above 20x.
What’s Your Decade, Man?
(aka, What's your STARTING PE MULTIPLE?)
The educational starting point of the investment profession appears to begin with Ibbotson & Sinquefield's Stocks, Bonds, Bills and Inflation studies. These studies measured asset returns from 1926-1974 and the concluded that stocks outperform “in the long term”.
I believe the extreme extent of the secular Bull market of the 80s was because the Baby Boomers understand what many conclude from this study - buy stocks for the long term.
Regrettably, the Boomers didn’t understand the “bigger” picture, and the bigger picture is that this study covered almost 50 years (and has been continually updated).
As Easterling and others point out, most people don't have 50 years to invest to achieve the "average" return (which is the Ibbotson & Sinquefield average). Rather, most people accumulate wealth in their 40s and begin using it in their 60s, so they have, at most, a 20 year investment horizon.
Boomers born after WW2 reached 40 around 1990, and the wealth they began to accumulate went into the market. However, they only had a decade before the market’s PE multiple reached AND SIGNIFICANTLY exceeded 20x.
The Boomers failed to realize the return they receive is mostly determined by the starting PE, so they continued putting money in the market when the PE was in excess of 20x (like now).
Ed Easterling's work implies there is not a lot of upside left at 20x, at least not over a 20 year period.
So what’s your time horizon, or “What’s your decade, Man?”
What should you do here?
Buy or Sell?
While I know we're in a secular bear market, I also realize that we're in one of those "up" cyclical bulls that so frequently occur in secular bear markets.
Look at the “BEARS table” again:

In the 3rd “up” column, I shutter to think we're currently up “ONLY” 54% thus far. The third bounce in the 70s reached 80%. Please DON’T look at the third "up" column in the 30s… I don't want to go there!
In the end, I still believe we’re in a secular Bear market. The PE multiple is still around 20x.
As such, I’m not going rely on "the long-term trend" because, as wrong as he was, Keynes was spectacularly right when he said “In the long run, we’re all dead.”
Rather, I expect continued volatility, down AND up.
And while this type of market is scary, it can be very profitable to trade stocks or options.
So I'll follow the wisdom of one of the greatest traders ever, Jesse Livermore (Reminiscences of a Stock Operator), who preached these principles:
1) Are we in a bull market or a bear?
(aka "let the market tell you")
2) What's the path of least resistance at the time of trade?
(aka, "stocks are never too high to buy or too low to sell")
3) Cut your losses and increase your winners.
(aka, "stocks are never too high to buy or too low to sell")
We're in a secular bear market, but if I trade today (10/27/09), the path of least resistance is up (cyclical bull within secular bear). I do think stocks are overvalued, but "stocks are never too high to buy". Until the "markets tell me", we're headed higher.
If you're afraid to buy now, follow another principle of Livermore - scale in and wait for your profit to tell you that you were right. If your loss becomes too high (many say 10-15%), cut your losses and be ready to become bearish. If the market moves up and you’re at a profit, Livermore would say your first instinct was right, so buy more.
Finally, what's the best advice I could give you?
This is a secular bear market, so tread lightly and trade smaller. The main goal right now is to maintain or accumulate enough assets to ride the coming bull market.
If I was a trend trader, like the guy in the "SA" article that “got my goat”, I'd look at the past 3 secular Bull markets and see increases 5x, 10x and 14x, respectively...
If this "trend" continues, the next bull market should be up 20x!


No comments:
Post a Comment